
Round #1 Complete!
Congratulations!!! The Andromeda Project team is happy to announce that we’ve completed the first installment of the project! In a little over two weeks, more than ten thousand dedicated citizen scientists produced one million image classifications, resulting in thousands of star cluster and galaxy identifications in images of the Andromeda galaxy.
We’ll be back in a few months with a second installment of data, but already citizen scientist volunteers have provided a rich, interesting set of objects for the science team to study. In the meantime, feel free to continue using the site: we’ll continue to record and use classifications that filter in over the next week or two. However, we’ve got the information we need for this batch of images. (In the meantime – check out some of the other Zooniverse projects that still need your help!)
This unbelievable response has surpassed all expectations from our team. Personally, I’ve been blown away by what you’ve accomplished. Before launch, the science team hoped to obtain between 20 and 50 classifications for each of our 12,000+ images over a period of a month or two. In only 16 days, we’ve obtained 80+ classifications per image, which allow us to build an extremely robust catalog of clusters and galaxies. In addition, the critical information that we’ve collected through the synthetic cluster tests will allow us to accurately interpret this sample of clusters, providing the science team an unprecedented opportunity to study cluster formation and destruction processes.
As a way of thanking everyone who participated in the project, I wanted to share a few preliminary results to show what all your hard work has help to produce.
After collecting and merging everyone’s classifications, we’ve produced an initial catalog of clusters and galaxies. Together, Andromeda Project participants have identified approximately 2,600 star clusters in Andromeda as well as about 1,400 background galaxies. These numbers are preliminary as we are still processing the final data and refining our analysis, however, we already know for sure that this catalog represents a huge improvement over our initial PHAT-based Year 1 cluster catalog and earlier ground-based work.

Preliminary Andromeda Project results: ~2600 star clusters and ~1500 background galaxies identified by citizen scientists. Black polygon shows footprint of PHAT survey and white dashed polygons denote regions where imaging has not yet been taken. These regions will be searched in Round #2.
As we said before, this is not the end of the Andromeda Project. We will return with a second set of data to classify in a few months time. But more importantly, now much of the science can begin! For starters, I will be presenting a poster of initial results at the American Astronomical Society (AAS) conference in Long Beach, CA that runs from January 7-10, 2013. Be sure to check back here on the blog, as I’ll talk about these results and other exciting developments as they come along.
We can’t say it enough – thank you for all your hard work. Not only do we appreciate your classification assistance, but you’ve really inspired us with your enthusiasm towards the project and your willingness to help do great science.
Cheers,
Cliff and the Andromeda Project Team
Power of Many
Today’s post comes from Benne Holwerda, an astronomer based at ESA-ESTEC in the Netherlands. Along with Bill Keel, Benne will be working on science focused on the background galaxies identified as part of the Andromeda Project. Benne writes today with a personal perspective on the remarkable response we’ve received for the Andromeda Project.
The underlying idea of Zooniverse projects is that many people working together can tackle problems that no single individual, no matter how good a specialist, can do themselves. I understood this on a conceptual level but the Andromeda Project brought it home in numbers and in person.
Seven years ago, I did my PhD on identifying background galaxies through foreground spiral galaxies in Hubble Space Telescope images. Sound familiar? You are doing the same! The total number of galaxies I identified in these HST images –half real and half artificial for calibration– was on the order of two thousand. It took me 2 years. The Andromeda Project just found the same number of galaxies behind Andromeda in a week!
One of the big perks of being a professional astronomer is that sometimes something literally awesome, as in you are awestruck, comes along: a new insight, a stunning image, a new discovery. For me, the ability of the Andromeda Project to identify a thousand little galaxies behind Andromeda in a mere week is one. It nailed me to my seat. Wow.

One of the numerous background galaxies seen in the Andromeda Project. This notable elliptical is enclosed in faint shells, likely produced through galaxy mergers.
Now, the best part: I get to play with those background galaxies!
Originally, I looked for background galaxies because I used their number to estimate how much interstellar dust spiral galaxies had on average. It worked fine at the time, but new observations by the Herschel Space Observatory are far more accurate now. Similarly, we have a good general map of dust in Andromeda from Herschel. I’ll look (if only for my own personal enjoyment), but their total number will not reveal much new information. But each individual galaxy might tell us something that the Herschel observations cannot: the small scale structure of dust in Andromeda. Bill Keel blogged about this last week. You pointed us to where they are, which ones are the biggest, and commented if you saw what looked like dust in front of them.
All in a week.
Highlights So Far
The Andromeda Project launched just over a week ago and what a week it’s been! The community that has formed behind this project is enthusiastic and prolific. Nearly 750,000 classifications have now been completed.
When we originally set out on this project we thought that somewhere between 50 and 100 people looking at each image would give us the statistics we need to be able to say how many clusters and galaxies were present in each image. We began hoping to get 50 views on each image but just a week later, more than 4,000 of the images already have had 80 views! This is actually fantastic news! With 80 people looking at each image, we will be able to produce some amazing and robust results. We’ll bring you more on the analysis of your clicks as soon as we can.


To celebrate almost 750,000 image classifications (that’s about one per second since launch!) we’ve gathered some highlights from our Talk site, to show off some of the images in the Andromeda Project, and some of the awesome collections you’ve produced on Talk. Above are just three really great images that you’ve spotted in the data and discussed on Talk.


There are several collections of these HII regions on Talk. What appear as blue, glowing globules in the Andromeda Project colours are in fact recent star-forming regions where young stars are now illuminating the material around them. User jasonjason has put together a nice collection here.


The main focus of the site is to find star clusters, which you’ve been doing in huge numbers. There are some great sets of different types of clusters on Talk. There are Bright Compact Clusters from jules, Open Clusters from wrights_kentucky, and even a set of synthetic clusters from jasonjason.


Of course galaxies are often the most beautiful objects in the Andromeda Project image and the community have been quick to collect them up on Talk. There are a lot of galaxy sets, but I thought I’d highlight this one from user Paula Giacomo and this SDSS galaxy set by JeanTate.
If you find interesting objects you can also comment on them and collect them up on Talk, which you can read more about on this blog post. There is lots more on this blog too, including a very handy FAQ list that answers questions about synthetic clusters and more.
Galaxies Behind A Galaxy
Today’s post comes from science team member Bill Keel from the University of Alabama. While Bill’s work is well-known within the Galaxy Zoo community, we thought it would be great for Bill to explain what science he and team member Benne Holwerda (ESA-ESTEC) hope to address with the background galaxies from the Andromeda Project.
This is a briefing on background. On deep background, really deep background. Among the things participants in the Andromeda Project mark are very distant background galaxies shining through Andromeda. In part, this is to make sure they don’t get confused with star clusters (or even nebulae) in the Andromeda galaxy itself. In addition, we can learn about the absorbing dust in the foreground by seeing what it does to the light of background galaxies. This is parallel to one of the projects carried out under Galaxy Zoo, finding examples of galaxies backlighting one another so we can map their dust. But in this case, of course the foreground galaxy is enormously closer, and there are vast numbers of faint background galaxies. This means we learn something different.
We know that spiral galaxies are dusty – a wide-field view of Andromeda shows this nicely, with the dark dust clouds along the spiral arms clearly outlined against the light of more distant stars. The amount and location of the dust control how it affects a galaxy’s overall light, and give clues to a galaxy’s past history of star formation (since dust not only participates in the cooling of gas to make new stars, but can be produced in the late stages of some stars’ lives). The overall dust properties of the whole spiral population are well addressed by the Galaxy Zoo search for backlit galaxies (whose results complement what we’re learning from far-infrared studies by such space telescopes as IRAS, Akari, Spitzer and Herschel). But seeing galaxies through Andromeda brings us something new – tracing small-scale structure in the dust clouds, right down to the resolution limit of Hubble’s images. We can learn about large-scale dust concentrations from both infrared data (where we see the dust shining by the radiation it gives off when slightly heated from absorbing starlight) and from the colors of stars in the Hubble PHAT images themselves. But both these techniques run out when we get to very small features – the resolution in the far-infrared is still too coarse, and there are usually not enough stars to outline such clouds. Hence, go to the background.
Here’s an example of what we particularly hope to find. The spiral galaxy IC 4633 is seen partly silhouetted behind a dust cloud in our own Milky Way. The cloud is close enough to some luminous stars to be shining more brightly by reflected light than we’d like, so the contrast is reduced, but it shows the principle – seeing a piece of a dust cloud against a background light source.

A ground-based gri color composite image of the galaxy IC4633. This galaxy is partially obscured by a dust lane that resides in our host galaxy, the Milky Way.
As so often happens, we stand on the shoulders of our predecessors. In setting up the work on background galaxies, we got a head start from a catalog compiled by Paul Hodge (University of Washington) and Karl Krienke (Seattle Pacific University) of obvious background galaxies in an earlier set of Hubble images in various parts of Andromeda. This gave us an excellent starting point in knowing how many to expect, how bright they had to be to show detail, and thus what we were getting in to.
Colleague Benne Holwerda and I will be looking at the background galaxy results, hoping to see some where we see this fine structure in the dust. Even if we don’t, the data on background galaxies will tell us what kinds of filaments and tendrils in the dust are not there, which is likewise interesting information.
You can learn more about Bill Keel at http://astronomy.ua.edu/keel, or read his Galaxy Zoo blog entries at http://blog.galaxyzoo.org/author/billkeel/
First Week FAQs
What a launch this has been! Although the Andromeda Project site has been live for less than a week, thousands of volunteers have already submitted more than 475,000 image classifications. This surpasses what any of us on the science team could have hoped for and we are thrilled with the enthusiasm of everyone who has participated. THANKS for all your hard work so far, and we’re looking forward to great things as the data continues to arrive!
We would like to take this opportunity to help answer some of the questions that we’ve received about the project. First, let me say that we’ve collected these questions and comments from the Talk site (talk.andromedaproject.org) – for an introduction to this tool, check out our earlier post Let’s Talk about Talk. If you have a question I don’t answer here, please start a discussion on that site.
Here we go:
“What’s a synthetic cluster?”
In addition to real clusters that appear in the images, the science team has inserted highly-realistic synthetic clusters into a portion of the images. These objects are essential to the scientific results we hope to obtain, as they allow us to determine which kinds of clusters can be detected in the images and which will be overlooked. Careful measurement of these limits will allow us to derive how Andromeda’s stellar clusters have evolved over time. Having you find these clusters is just as important for many of our science goals as the real clusters!
This task requires a significant number of synthetic test objects to make sure we can model how our ability to identify clusters changes due to different competing effects. These factors include cluster size, cluster age, and a cluster’s location in Andromeda and the density of stars in the image.
These synthetic clusters are also a way to provide some feedback on how you’re doing with cluster identification. Unlike the real clusters, we know where these objects are located in the image ahead of time. That allows us to tell you when you’ve correctly identified a synthetic cluster. If you’re finding the synthetic clusters, you are likely identifying new, real clusters as well!
“What’s that?” Check out the Guide!
Are you curious about why some clusters look different than others? Wondering what’s up with the bright stars? We’ve put together a wealth of information about clusters and other Andromeda objects in the Guide. Check it out — and if you find something you still can’t explain, be sure to bring it up on the Talk site (might I suggest: #weird).
Many people have asked about “sinuous dust lanes” that appear as darker patches in the color images. Indeed, these are caused by the attenuation of light by filaments of dust in Andromeda that are situated between the majority of the stars in the galaxy’s disk and our viewing location. This dust will block more of the blue light than red light, so the presence of dust can be detected as regions where all of the stars are much redder or dimmer than their surroundings. These structures are typically large and extended, making it hard to understand what is going on at the small scale of the Andromeda Project’s search images. Below is an example of a large area cutout from our Hubble Space Telescope imaging to give a better example of what these dust filaments look like on larger scales.
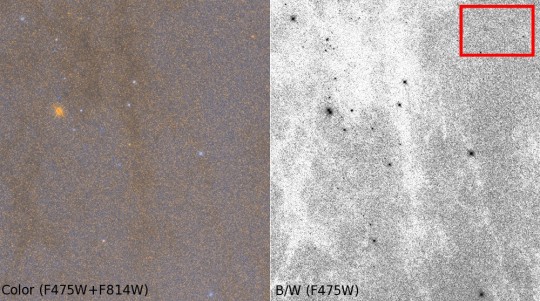
Large scale Hubble Space Telescope images that show the structure of the dust filaments in Andromeda. The red box shows the size of a single search image for the Andromeda Project.
Site Issues and Bugs
While we do our best to make sure the site is ready for everyone to use, problems will inevitably appear from time to time, particularly during the early days of the project. Please visit the “Help” board on Talk to report any problems – for best results, please provide a detailed description of the problem as well as the versions of your operating system and web browser. The development team is working hard to identify and remedy issues as soon as possible, so if you can’t use the site, please check back in a day or two when we hope to have fixed any problem you run across.
“Am I doing it right?”
Yes, you’re probably doing great! Once you’ve gone through the tutorial, read the information provided in the Guide, and classified a few images, you have all the training you need to help with this project. The best advice: practice makes perfect! Make sure to use the B/W and Color image toggle button to look at all the available data, but don’t get stuck trying to perfect every image. Do your best and over time you’ll improve as you get the hang of it.
It is important to remember that many people will view every image. If you miss a cluster by accident, hit “Finish” too soon, or otherwise wish you could get a re-do on a particular image: don’t worry. We combine everyone’s classifications together to create the final catalog, and through this collective effort participants make up for any individual small errors that might occur along the way.
In fact, this strategy of averaging over many individuals has already show its usefulness in this project. Results obtained for a small number of images during pre-launch testing of the Andromeda Project show that the “wisdom of the crowd” leads to higher overall catalog quality than those constructed using identifications from professional astronomers. The difference is that instead of only two to four trained astronomers, where innocent mistakes by an individual have a relatively large impact on the final result, the Andromeda Project uses classifications from many people per image. The more people classify an image, the better the result will become!
Now it’s time to start analyzing this awesome data. Stay tuned for more details about the science we hope to do with this data set in the coming weeks.
Cliff Johnson is a PhD student in Astronomy at the University of Washington in Seattle, WA, USA. His website: http://www.astro.washington.edu/users/lcjohnso
The Big PHAT Survey
So, after you’ve looked at 10, or maybe 1000 images, some of you may be wondering, “Just where did all this amazing data come from?”
Some Background: This project had its roots about 5 years ago, when the good folks who run the Hubble Space Telescope started wondering about the telescope’s legacy. Hubble is currently like a really great old car with a rebuilt engine — it does what it’s supposed to do really well, but you also wouldn’t be surprised if something went wrong. With this in mind, the question that arose was “If something were to happen to the Hubble, are there any important, lasting data sets that we wish we would have acquired?” And in particular, were there projects that were sooooo big that no one would have dared to ask for the needed time, in spite of being exactly the sort of lasting legacy that the telescope should leave behind?
In 2007, the Space Telescope Science Institute polled the community and asked for “white papers” describing possible big projects that Hubble should consider doing. Tons of great ideas flowed in, and based on that, it was decided that there would be a once in a lifetime call for “multi-cycle” proposals. The idea was to propose important projects that needed so much data that the observations couldn’t even be done in a single year (known as an observing “cycle”).
In other words, they wanted “awesome, but crazy”.
And we thought that mapping Andromeda fit that bill perfectly.
The Panchromatic Hubble Andromeda Treasury: While the Milky Way is a great place to study stars, it’s often a confusing place to work — you don’t know exactly how far away any given star is and there’s lots of dust to get in your way. Instead, if we look at Andromeda, we know all the stars are at nearly the same distance, and we have much less dust to block our view. The overall goal of the PHAT survey is therefore to map a huge fraction of the stars in the galaxy, and characterize them from ultraviolet (UV) to near-infrared (NIR) wavelengths. These stars, along with their ancestors and descendants (e.g., molecular clouds, HII regions, variable stars, X-ray binaries, supernova remnants, etc.), provide opportunities for enormous advances in the foundation on which all knowledge of the distant Universe is based. In other words, if you’re going to understand distant blobby galaxies, you’d better know all the details of the stuff that makes them up!
How the Survey Works: There are two keys to making the PHAT survey work. The first is to get lots and lots of Hubble time (Check!). The second is to find the single most efficient way to use that time, to get as many exposures at as many different wavelengths as possible. We do this by using two different cameras simultaneously. While one camera (Wide Field Camera 3: WFC3) is exposing, so is the Advanced Camera for Surveys (ACS), but pointing at a sightly different part of the sky. To map out large areas, we march the WFC3 camera around in a little 3×3 grid, while the ACS camera maps out an adjacent grid. Then, around six months later, we can rotate the telescope 180 degrees, and repeat the same exercise, but this time having WFC3 point to the area ACS covered previously, and vice versa.
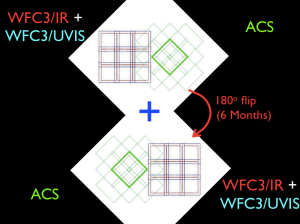
Below, you can see a map of our current coverage, which shows a few regions where we only have the first half of the 3×6 “brick”. We should be getting the other halves of those bricks filled in during the coming months.

Why So Many Filters? Stars have a huge range in temperatures, from extremely cool (astronomically speaking) to ridiculously hot. Unfortunately, this leads to very large changes in where the stars emit their light. The hot stars can be booming in the UV, but faint in the NIR, whereas the cool stars are exactly the opposite. You therefore need a wide range of wavelengths to make sure you’re getting good detections of all kinds of stars. In addition, having a lot of filters allows us to do fancy things like solve for the exact amount of dust in front of a star, or to identify unusual objects like planetary nebulae. For cluster finding however, we only use the optical images (the two middle filters in the plot below) — these images are easy to make, and give plenty of information just on their own.

PHAT filters (top) compared to spectra of different types of stars (bottom)
What’s Next? As you can see from the map above, we still have some more observations to take (some of which are scheduled to take place next week!!!). If all goes well, we hope to have the last of our data in hand by the start of next fall (2013). As we finish up new large chunks of the survey, we’ll add more images to the Andromeda Project. So keep practicing, cluster hunters!
Let’s Talk about Talk
We hope you are enjoying the Andromeda Project! If you find something spectacular or unexpected or have a question about the site or the science don’t keep it to yourself. We’d like the Andromeda Project community to chat and ask questions so we have provided a special discussion tool called Talk. It’s a lot like a forum but easier to find as you are given the option to chat about an object straight after you have classified it. Many of you are already making good use of Talk and it’s great to have your comments and feedback. This allows the team to fix glitches and answer your questions.
So where is Talk? When you have finished marking your image you will see the question “Would you like to discuss this image in Talk?” If you click “Yes” you will be taken to a page on Talk where you can say something about the image you just classified and also see what anyone else has said about it. You do need to be logged in, however, to post comments and make full use of Talk.
If you want to go into more detail you have the chance to start a discussion, or contribute to an existing one. You can even “watch” a discussion. Click on “watch discussion” and if anyone adds to the discussion you will receive an e-mail alert. Just make sure you have e-mail notifications enabled in your profile settings. When you’re done just click on “Return to Andromeda Project“ to resume classifying. Don’t feel you have to discuss every image but we’d really like to know about the ones you find interesting and unusual.
To help the scientists and the community keep track of what is being classified and discussed we’d like you to use hashtags (#) with a keyword to describe what you find, for example, #bright-cluster, #faint-cluster, #galaxies or #stars. In this way the community can create lists which can be searched.
You can also put objects you find into a collection. When you click “discuss this object” just click on “collect this” under the image and give your collection a name. You can see other people’s collections next to the images.
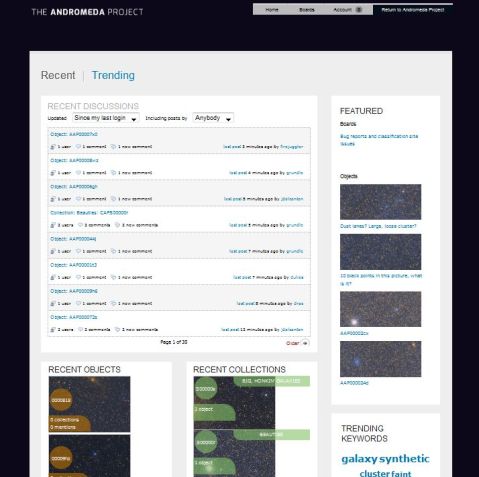
Hover your mouse over the menu at top right: “Home, Boards, Account” to see them expand. Clicking on “Home” shows you recent and featured discussions and trending keywords. You will also find a more detailed Talk tutorial in the Home menu. You can send messages to other community members using the link under “Account” and you can discuss things forum style on one of 3 Boards: Chat, Science and Help.
Chat: is where you can chat with the rest of the community. Virtual tea and coffee are always available!
Science: is a place to have general science discussions related to the Andromeda Project. The science team will look out for your questions.
Help: is your first point of call if you get stuck. This is where you can discuss the website and report any problems you’re having. The techies will keep an eye on this board.
You can also go directly to Talk from talk.andromedaproject.org
However you get there, come and Talk to us, we’re waiting!
Welcome to the Andromeda Project!
We’re very excited you’ve taken the time to visit the new Andromeda Project site! With your help, we’re going to identify the largest sample of star clusters known in any spiral galaxy, including our own Milky Way. We will use the clusters you find to study the history of Andromeda and to better understand how stars form.

The beautiful images you will be looking at come from the Hubble Space Telescope. Since 2010, Hubble has spent nearly two months of time looking at Andromeda as part of the Panchromatic Hubble Andromeda Treasury (PHAT) survey. For the Andromeda Project, we’ve broken these pictures up into more than 9,000 separate images; there are more than 3 billion pixels that we need you to help us examine!
Star clusters are groups of hundreds to millions of stars that are all born together. This means that their ages are (relatively) easy to determine, and the first thing we do after you find the clusters will be to measure their ages and masses. Once their ages and masses are known, we can use these clusters to mark major formation epochs in the galaxies’ history. We will also identify the youngest star clusters which we can use to test theories of star formation.
In addition to star clusters, you’ll also be identifying background galaxies and image artifacts. We will use the galaxies to study the gas and dust within Andromeda; Galaxy Zoo veteran Bill Keel will have a blog post about this soon.
We’d like to thank our wonderful beta testers who helped make this site more usable. If you have any questions or comments take a look at the About and Guide sections, or create a post in the Talk section.
Good luck cluster hunters!
Anil
Anil Seth is an assistant professor at the University of Utah’s Physics & Astronomy department (http://www.physics.utah.edu/~aseth/)
