
Round 2 is Complete!
On behalf of the Andromeda Project science team: THANK YOU! We’re (already) done!
Wow. That was unexpected! Before we launched we had expected this second round might take us months to finish. It just goes to show – never underestimate the power of the Zooniverse!
The second round of Andromeda Project took a little more than a week, during which we collected ~750,000 image classifications. This brings the grand total for the project up to ~1.8 million images searched! We had more than 5,000 volunteers hunt clusters this round. In other words, this was a tremendous result that (again!) surpassed our expectations – very impressive!
The science team will get straight to work: over the next few weeks, we’ll combine everyone’s image classifications to create a final catalog of clusters and galaxies that you’ve help identify. Then the real fun begins! We will use the Andromeda Project cluster catalog to study individual, interesting star clusters, and to answer questions about the galaxy-wide cluster population.
And we want to give a special thank you to I F*&king Love Science, who helped bring many of you to us to create this unprecedented spike in image classifications:

Certainly a record number per hour for the Andromeda Project!
While this marks the end of our efforts to search the PHAT data for clusters, we are working on a few ideas for other Andromeda-related projects that we think the Zooites can help us on. Stay tuned here on this blog! We’ll keep everyone updated on our progress over the next few months.
Round 2: Welcome Back!
We’re back! After a successful first round last December, we are relaunching the Andromeda Project for a second round of cluster finding in our galaxy neighbor, Andromeda (aka: M31). More than 10,000 volunteers pitched in during Round 1 to search about 80% of the Panchromatic Hubble Andromeda Treasury (PHAT) survey imaging. The Hubble Space Telescope (HST) was able to image the remaining portions of the galaxy over the past year, completing a >3 year effort to survey Andromeda on October 12th. In Round 2, we will complete our cluster search of the remaining PHAT images as well as search other Hubble images of M31, which I will talk about a bit more later on.
Previously on this blog I’ve talked about the results we’ve been able to derive, thanks to the efforts of the AP community, but I wanted to emphasize again how invaluable everyone’s participation has been. Using the first round identifications, we constructed a star cluster catalog containing almost 3000 star clusters, representing a 10x increase over previous catalogs of that portion of Andromeda. The quality of this catalog has allowed us to start answering questions about how clusters form and evolve within the galaxy.

Andromeda Project search regions: PHAT survey (white) and archival images (red). Image Credit: Robert Gendler
In Round 2, we include two sets of Andromeda images: the final PHAT images and images obtained from the HST archive. The PHAT images we feature this round are 1) those that were observed in the past year (or past month, even!) and 2) images that stretch out to the limits of the survey. You may encounter blank, black portions of images during your searching. No need to worry – these parts of the image represent portions of sky not imaged as part of the survey. Also, you might occasionally encounter a synthetic cluster – an object that we’ve added into the images. As Matt talked about in last week’s blog post, these synthetic clusters are crucial to helping us understand what objects we can and cannot detect.
So, how about the other set of images? What is the HST archive? The Space Telescope Science Institute (STSci), who operates Hubble, hosts a website called the Barbara A. Mikulski Archive for Space Telescopes (MAST) where data from space observatories like Hubble (and other notable missions such as Kepler and GALEX) are stored. This archive is critically important to astronomers, allowing them to find and use images or spectra that were obtained by instruments on Hubble.
Every observation taken by HST is stored and made publicly available, ensuring that they can be used for science in the future. The open availability of these data allow observations to be used by multiple researchers, sometimes in ways that were not originally anticipated. The Andromeda Project is a perfect example of this repurposing: the archival images we include in Round 2 are images obtained as part of an observing program to follow-up on candidate gravitational microlensing events detected within M31. Now we can reuse these images to assist in our study of star clusters!
Remember: these images are publicly available to anyone. That means you! The folks at MAST host a website called the Hubble Legacy Archive (HLA) that provides users an interface to search and view archival images. For an introduction to the HLA, check out this page. Many of our PHAT images are already available for browsing and download through the HLA as well. Try searching for “M31”; some of my other favorites include “M82” or the “Antennae”.
On behalf of the whole Andromeda Project team, I thank you for your interest and assistance. Be sure to sign in when you visit andromedaproject.org and let’s go find some clusters!
Andromeda Project Analysis, Part II: Synthetic Clusters
For many of you, the most satisfying (or frustrating?) part of Round 1 was clicking on a synthetic cluster. This post explains what these clusters are and how we’re using them. Synthetic clusters help us to calibrate your cluster clicks. These clusters serve a similar purpose to a control group in biological and psychological experiments. We made the synthetic clusters, so we already know their age, mass, and size. We can use these to understand not only what types of clusters we find, but also what clusters we don’t find. For example, say that we find there are no clusters in Andromeda with ages between 100 and 200 million years old. This could either be because there are no clusters at these ages (an interesting science result!!!) or because we just can’t find them because they aren’t easy to detect. Only through using synthetic clusters can we differentiate between these scenarios.
For Round 1, we generated 3100 of these clusters and inserted them in random locations in 3100 selected images. Here’s an example of a portion of a field without and with a synthetic cluster:


We designed the synthetic clusters to be identified at about a 50% rate in Round 1. You exceeded our expectations by identifying ~65% of synthetic clusters! Here’s a plot showing how you did on identifying each of the Round 1 synthetic clusters:

Each dot in this plot is one of the 3100 synthetic clusters. The horizontal axis of this plot is the cluster’s brightness and the vertical axis is the cluster’s Round 1 clusterfrac (the fraction of all viewers that identified the object as a cluster). Color on this plot is used to indicate cluster age. The bright young clusters were the most easily identified, which you can see as the group in the upper left of the plot. On the other hand, old, reddish and dim clusters were the most difficult to find; these are at the bottom right of the plot. You can see that younger clusters tend to be brighter than older clusters; this is because big hot bright stars burn out quickly, and smaller dimmer stars live much longer lives, so clusters get dimmer as they get older. Younger clusters also often contain large well-resolved blue stars, making them easier to identify, while older clusters have fewer big blue stars and often appear as partially resolved orange patches, making them harder to identify.
One of the most important things we can learn from our cluster sample is what mass of clusters we can detect. The completeness is the fraction of clusters at a given mass that were identified. The plot below shows this completeness as we vary the clusterfrac. This plot includes clusters less than 100 million years old.

The horizontal axis is the cluster’s mass in solar masses and the vertical axis is the completeness, or the fraction of all young synthetic clusters that you identified. If you just look at the blue line it tells you that at 1,000 solar masses, nearly 80% of young synthetic clusters were identified by at least 35% of you. The take home message of this plot is that we’re detecting most of the clusters with masses more than a few hundred times the mass of the sun; this is a much lower mass than we can detect in most galaxies outside the Milky Way.
But our search for the truth is not yet complete! There will be more synthetic clusters in Round 2. We’ll be using these to test for consistency between Round 1 and 2 and to correct for biases in the detection of some clusters.
Update on Andromeda Project Analysis, Part I
All of us here at the Andromeda Project are really excited to re-launch the project for a second round of classification in mid-October. While we’re busily getting everything ready for you to look at, I thought we could provide you with an update of what we’ve been doing to analyze your work since last December.
The Basics — From Clicks to Clusters
The primary goal of the Andromeda Project is to find star clusters big and small. Our hard-working Round 1 participants looked at over 1 million images clicking on all the clusters they found. This meant at least 80 of you looked at each of the 12,425 Round 1 images. A University of Utah undergraduate student, Matt Wallace, who has joined the Andromeda Project Science Team found looking at your image clicks a mesmerizing process and made this movie — the drawings are color-coded by the type of object (cluster=white, galaxy=green):
The simplest way we can translate these clicks into real clusters is to look at the fraction of people that called an object a cluster. If 72 of the 80 people that looked at an image circled the same object, then that object has a “ClusterFrac” of 0.90 or 90%, while if only 8 of the 80 people clicked on something, its ClusterFrac is 0.10. The simplest way we can find clusters is to choose a threshold ClusterFrac (e.g. 0.35) — by picking only objects above this threshold we get mostly real clusters without including too many objects that aren’t clusters.
Our Testing Ground — the Year 1 Sample
How do we know if we’re finding the clusters that we want to find? One reference point is the “Year 1” cluster sample, published in Johnson et al. 2012. This sample is based on about 20% of the Andromeda Project images that a group of professional astronomers looked through to create our initial cluster catalog of 601 good star clusters, as well as a catalog of galaxies and other non-cluster objects. We can compare the fraction of these Year 1 clusters found to assess the completeness of the Andromeda Project cluster sample. A completeness value of 0.90 means that 90% of these Year 1 clusters were found by Andromeda project users. The lower we make the ClusterFrac threshold, the higher the resulting completeness. We can also look at all the other objects that were found that might be contaminants; these include previously classified galaxies and objects we previously decided weren’t clusters as well as objects that were not identified by professional astronomers during the Year 1 search (at least some of which may be real clusters!!!!).
The plot below summarizes how we make the comparison between the Andromeda Project data and the Year 1 cluster sample.

The top panel of this plot shows the ClusterFrac threshold required to get the completeness shown on the horizontal x-axis. For instance, to achieve 90% completeness of the Year 1 cluster catalog, we need to use a ClusterFrac threshold of 0.35 (i.e. where at least 35% of people clicked on the candidates). In the bottom panel, we can look at the number of possible non-cluster contaminants we pick up along with the good clusters. For instance, for 90% completeness in the Year 1 sample, we find a few percent of the objects in the sample are known galaxies, 7-8% are objects we previously decided were not clusters and a similar number of objects were previously unidentified. On the other hand, if we use a ClusterFrac threshold of 0.5, contaminants make up <10% of the sample, but we only include ~75% of the Year 1 clusters. Our goal is to try analyzing the data in a way to maximize the completeness and minimize the number of contaminants. As part of this effort we’re weighting users based on how well they did at identifying good clusters and trying to determine what objects might be being missed by Andromeda Project users. This may sound kind of critical, so we’d like to emphasize how awesome the data is. Regardless of how we analyze the data, the Andromeda Project will produce the largest and best characterized sample of clusters known in any galaxy! Thanks to you!
First Results at AAS
This week in Long Beach, CA at a meeting of the American Astronomical Society (AAS), I presented first results from the Andromeda Project. Thanks to the help of ~5100 registered participants and thousands of others who classified images, the science team was able to create an initial catalog a little more than one month after the launch of the site. This turn-around time amazed me, the science team, and nearly every astronomer I spoke to at the conference.

Cliff Johnson presenting Andromeda Project results at the 221st meeting of the American Astronomical Society in Long Beach, CA.
The full poster can be downloaded in PDF format at this link, but here is a summary of the main points from our presentation:
1) We have a great sample of clusters (and galaxies)!
Thanks to the resolving power of the Hubble Space Telescope (HST), Andromeda Project participants identified ~2900 star clusters and ~1700 background galaxies. The new cluster catalog is ~10 times larger than previous ground-based catalogs. Not only does the size of the sample dwarf previous catalogs in terms of number of objects, but it also includes clusters that are ~40 times fainter than previously identified objects.
2) Awesome Citizen Science Participation
As I said before, the response to the site was quite amazing: over the course of 16 days, participants submitted more than 1 million image classifications and collectively spent more than a year of time on the site. Also, many of the astronomers I talked to were quite surprised to see just how international our participation was: about one-third of our registered participants are from Europe.
3) Synthetic Cluster Tests Reveal Important Information
The synthetic clusters inserted in the Andromeda Project search images have already produced some important insights into the accuracy and completeness of the resulting cluster catalog. In the past, astronomers assumed that the detection of a cluster depended solely on the luminosity of the cluster: objects brighter than some luminosity limit could be detected, while objects fainter than that limit were not likely to be identified. Using the results from the synthetic cluster tests, we can already see that such simple assumptions do not hold for our data. Due to our ability to identify faint clusters where most of the light from the cluster could come from only one or two individual stars, we must take a different approach to properly model cluster detection for the Andromeda Project.
4) Work In Progress
The science team continues to improve our catalog construction techniques in an effort to make the most accurate catalog possible. For instance, when we were able to incorporate all of the image classification data, we increased the number of cataloged clusters from the ~2,600 total that we announced in this previous blog entry to ~2,900. We expect this number to fluctuate at the ~10% level while we continue to refine the construction techniques and identification thresholds we use to build the cluster catalog. That’s part of the scientific process: we continue to improve our analysis to achieve the most accurate possible answers on our way towards finalizing and publishing our results.
5) Next Steps
Now that we have our sample of clusters, we can start to analyze these objects in detail: determining the age, mass, and structural parameters (size and concentration) for each cluster. Using these characteristics, we will start to piece together the formation and destruction history of clusters within the disk of Andromeda. In addition, we are already in the planning stages for Round 2 of the project, with a goal of re-launching at the end of the summer once we have completed all data collection from Hubble.
Stay tuned: the science team will provide occasional updates here on the blog as we uncover interesting new aspects of the data.
Round #1 Complete!
Congratulations!!! The Andromeda Project team is happy to announce that we’ve completed the first installment of the project! In a little over two weeks, more than ten thousand dedicated citizen scientists produced one million image classifications, resulting in thousands of star cluster and galaxy identifications in images of the Andromeda galaxy.
We’ll be back in a few months with a second installment of data, but already citizen scientist volunteers have provided a rich, interesting set of objects for the science team to study. In the meantime, feel free to continue using the site: we’ll continue to record and use classifications that filter in over the next week or two. However, we’ve got the information we need for this batch of images. (In the meantime – check out some of the other Zooniverse projects that still need your help!)
This unbelievable response has surpassed all expectations from our team. Personally, I’ve been blown away by what you’ve accomplished. Before launch, the science team hoped to obtain between 20 and 50 classifications for each of our 12,000+ images over a period of a month or two. In only 16 days, we’ve obtained 80+ classifications per image, which allow us to build an extremely robust catalog of clusters and galaxies. In addition, the critical information that we’ve collected through the synthetic cluster tests will allow us to accurately interpret this sample of clusters, providing the science team an unprecedented opportunity to study cluster formation and destruction processes.
As a way of thanking everyone who participated in the project, I wanted to share a few preliminary results to show what all your hard work has help to produce.
After collecting and merging everyone’s classifications, we’ve produced an initial catalog of clusters and galaxies. Together, Andromeda Project participants have identified approximately 2,600 star clusters in Andromeda as well as about 1,400 background galaxies. These numbers are preliminary as we are still processing the final data and refining our analysis, however, we already know for sure that this catalog represents a huge improvement over our initial PHAT-based Year 1 cluster catalog and earlier ground-based work.

Preliminary Andromeda Project results: ~2600 star clusters and ~1500 background galaxies identified by citizen scientists. Black polygon shows footprint of PHAT survey and white dashed polygons denote regions where imaging has not yet been taken. These regions will be searched in Round #2.
As we said before, this is not the end of the Andromeda Project. We will return with a second set of data to classify in a few months time. But more importantly, now much of the science can begin! For starters, I will be presenting a poster of initial results at the American Astronomical Society (AAS) conference in Long Beach, CA that runs from January 7-10, 2013. Be sure to check back here on the blog, as I’ll talk about these results and other exciting developments as they come along.
We can’t say it enough – thank you for all your hard work. Not only do we appreciate your classification assistance, but you’ve really inspired us with your enthusiasm towards the project and your willingness to help do great science.
Cheers,
Cliff and the Andromeda Project Team
Power of Many
Today’s post comes from Benne Holwerda, an astronomer based at ESA-ESTEC in the Netherlands. Along with Bill Keel, Benne will be working on science focused on the background galaxies identified as part of the Andromeda Project. Benne writes today with a personal perspective on the remarkable response we’ve received for the Andromeda Project.
The underlying idea of Zooniverse projects is that many people working together can tackle problems that no single individual, no matter how good a specialist, can do themselves. I understood this on a conceptual level but the Andromeda Project brought it home in numbers and in person.
Seven years ago, I did my PhD on identifying background galaxies through foreground spiral galaxies in Hubble Space Telescope images. Sound familiar? You are doing the same! The total number of galaxies I identified in these HST images –half real and half artificial for calibration– was on the order of two thousand. It took me 2 years. The Andromeda Project just found the same number of galaxies behind Andromeda in a week!
One of the big perks of being a professional astronomer is that sometimes something literally awesome, as in you are awestruck, comes along: a new insight, a stunning image, a new discovery. For me, the ability of the Andromeda Project to identify a thousand little galaxies behind Andromeda in a mere week is one. It nailed me to my seat. Wow.

One of the numerous background galaxies seen in the Andromeda Project. This notable elliptical is enclosed in faint shells, likely produced through galaxy mergers.
Now, the best part: I get to play with those background galaxies!
Originally, I looked for background galaxies because I used their number to estimate how much interstellar dust spiral galaxies had on average. It worked fine at the time, but new observations by the Herschel Space Observatory are far more accurate now. Similarly, we have a good general map of dust in Andromeda from Herschel. I’ll look (if only for my own personal enjoyment), but their total number will not reveal much new information. But each individual galaxy might tell us something that the Herschel observations cannot: the small scale structure of dust in Andromeda. Bill Keel blogged about this last week. You pointed us to where they are, which ones are the biggest, and commented if you saw what looked like dust in front of them.
All in a week.
Galaxies Behind A Galaxy
Today’s post comes from science team member Bill Keel from the University of Alabama. While Bill’s work is well-known within the Galaxy Zoo community, we thought it would be great for Bill to explain what science he and team member Benne Holwerda (ESA-ESTEC) hope to address with the background galaxies from the Andromeda Project.
This is a briefing on background. On deep background, really deep background. Among the things participants in the Andromeda Project mark are very distant background galaxies shining through Andromeda. In part, this is to make sure they don’t get confused with star clusters (or even nebulae) in the Andromeda galaxy itself. In addition, we can learn about the absorbing dust in the foreground by seeing what it does to the light of background galaxies. This is parallel to one of the projects carried out under Galaxy Zoo, finding examples of galaxies backlighting one another so we can map their dust. But in this case, of course the foreground galaxy is enormously closer, and there are vast numbers of faint background galaxies. This means we learn something different.
We know that spiral galaxies are dusty – a wide-field view of Andromeda shows this nicely, with the dark dust clouds along the spiral arms clearly outlined against the light of more distant stars. The amount and location of the dust control how it affects a galaxy’s overall light, and give clues to a galaxy’s past history of star formation (since dust not only participates in the cooling of gas to make new stars, but can be produced in the late stages of some stars’ lives). The overall dust properties of the whole spiral population are well addressed by the Galaxy Zoo search for backlit galaxies (whose results complement what we’re learning from far-infrared studies by such space telescopes as IRAS, Akari, Spitzer and Herschel). But seeing galaxies through Andromeda brings us something new – tracing small-scale structure in the dust clouds, right down to the resolution limit of Hubble’s images. We can learn about large-scale dust concentrations from both infrared data (where we see the dust shining by the radiation it gives off when slightly heated from absorbing starlight) and from the colors of stars in the Hubble PHAT images themselves. But both these techniques run out when we get to very small features – the resolution in the far-infrared is still too coarse, and there are usually not enough stars to outline such clouds. Hence, go to the background.
Here’s an example of what we particularly hope to find. The spiral galaxy IC 4633 is seen partly silhouetted behind a dust cloud in our own Milky Way. The cloud is close enough to some luminous stars to be shining more brightly by reflected light than we’d like, so the contrast is reduced, but it shows the principle – seeing a piece of a dust cloud against a background light source.

A ground-based gri color composite image of the galaxy IC4633. This galaxy is partially obscured by a dust lane that resides in our host galaxy, the Milky Way.
As so often happens, we stand on the shoulders of our predecessors. In setting up the work on background galaxies, we got a head start from a catalog compiled by Paul Hodge (University of Washington) and Karl Krienke (Seattle Pacific University) of obvious background galaxies in an earlier set of Hubble images in various parts of Andromeda. This gave us an excellent starting point in knowing how many to expect, how bright they had to be to show detail, and thus what we were getting in to.
Colleague Benne Holwerda and I will be looking at the background galaxy results, hoping to see some where we see this fine structure in the dust. Even if we don’t, the data on background galaxies will tell us what kinds of filaments and tendrils in the dust are not there, which is likewise interesting information.
You can learn more about Bill Keel at http://astronomy.ua.edu/keel, or read his Galaxy Zoo blog entries at http://blog.galaxyzoo.org/author/billkeel/
First Week FAQs
What a launch this has been! Although the Andromeda Project site has been live for less than a week, thousands of volunteers have already submitted more than 475,000 image classifications. This surpasses what any of us on the science team could have hoped for and we are thrilled with the enthusiasm of everyone who has participated. THANKS for all your hard work so far, and we’re looking forward to great things as the data continues to arrive!
We would like to take this opportunity to help answer some of the questions that we’ve received about the project. First, let me say that we’ve collected these questions and comments from the Talk site (talk.andromedaproject.org) – for an introduction to this tool, check out our earlier post Let’s Talk about Talk. If you have a question I don’t answer here, please start a discussion on that site.
Here we go:
“What’s a synthetic cluster?”
In addition to real clusters that appear in the images, the science team has inserted highly-realistic synthetic clusters into a portion of the images. These objects are essential to the scientific results we hope to obtain, as they allow us to determine which kinds of clusters can be detected in the images and which will be overlooked. Careful measurement of these limits will allow us to derive how Andromeda’s stellar clusters have evolved over time. Having you find these clusters is just as important for many of our science goals as the real clusters!
This task requires a significant number of synthetic test objects to make sure we can model how our ability to identify clusters changes due to different competing effects. These factors include cluster size, cluster age, and a cluster’s location in Andromeda and the density of stars in the image.
These synthetic clusters are also a way to provide some feedback on how you’re doing with cluster identification. Unlike the real clusters, we know where these objects are located in the image ahead of time. That allows us to tell you when you’ve correctly identified a synthetic cluster. If you’re finding the synthetic clusters, you are likely identifying new, real clusters as well!
“What’s that?” Check out the Guide!
Are you curious about why some clusters look different than others? Wondering what’s up with the bright stars? We’ve put together a wealth of information about clusters and other Andromeda objects in the Guide. Check it out — and if you find something you still can’t explain, be sure to bring it up on the Talk site (might I suggest: #weird).
Many people have asked about “sinuous dust lanes” that appear as darker patches in the color images. Indeed, these are caused by the attenuation of light by filaments of dust in Andromeda that are situated between the majority of the stars in the galaxy’s disk and our viewing location. This dust will block more of the blue light than red light, so the presence of dust can be detected as regions where all of the stars are much redder or dimmer than their surroundings. These structures are typically large and extended, making it hard to understand what is going on at the small scale of the Andromeda Project’s search images. Below is an example of a large area cutout from our Hubble Space Telescope imaging to give a better example of what these dust filaments look like on larger scales.
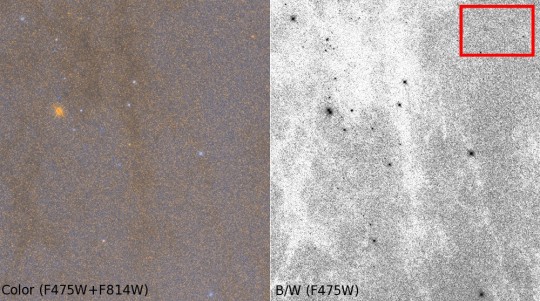
Large scale Hubble Space Telescope images that show the structure of the dust filaments in Andromeda. The red box shows the size of a single search image for the Andromeda Project.
Site Issues and Bugs
While we do our best to make sure the site is ready for everyone to use, problems will inevitably appear from time to time, particularly during the early days of the project. Please visit the “Help” board on Talk to report any problems – for best results, please provide a detailed description of the problem as well as the versions of your operating system and web browser. The development team is working hard to identify and remedy issues as soon as possible, so if you can’t use the site, please check back in a day or two when we hope to have fixed any problem you run across.
“Am I doing it right?”
Yes, you’re probably doing great! Once you’ve gone through the tutorial, read the information provided in the Guide, and classified a few images, you have all the training you need to help with this project. The best advice: practice makes perfect! Make sure to use the B/W and Color image toggle button to look at all the available data, but don’t get stuck trying to perfect every image. Do your best and over time you’ll improve as you get the hang of it.
It is important to remember that many people will view every image. If you miss a cluster by accident, hit “Finish” too soon, or otherwise wish you could get a re-do on a particular image: don’t worry. We combine everyone’s classifications together to create the final catalog, and through this collective effort participants make up for any individual small errors that might occur along the way.
In fact, this strategy of averaging over many individuals has already show its usefulness in this project. Results obtained for a small number of images during pre-launch testing of the Andromeda Project show that the “wisdom of the crowd” leads to higher overall catalog quality than those constructed using identifications from professional astronomers. The difference is that instead of only two to four trained astronomers, where innocent mistakes by an individual have a relatively large impact on the final result, the Andromeda Project uses classifications from many people per image. The more people classify an image, the better the result will become!
Now it’s time to start analyzing this awesome data. Stay tuned for more details about the science we hope to do with this data set in the coming weeks.
Cliff Johnson is a PhD student in Astronomy at the University of Washington in Seattle, WA, USA. His website: http://www.astro.washington.edu/users/lcjohnso
